Beyond calories: how Misi tracks your macros and micronutrients
Hitting your protein target says nothing about whether you got enough potassium, magnesium or vitamin D. Misi tracks the full picture — macros and micros — and shows you the gaps.
Most tracking apps stop at four numbers: calories, protein, carbs and fat. Those matter — but a diet that nails its macros can still leave you chronically short on the micronutrients that drive energy, recovery, sleep and long-term health.
The macros, done properly
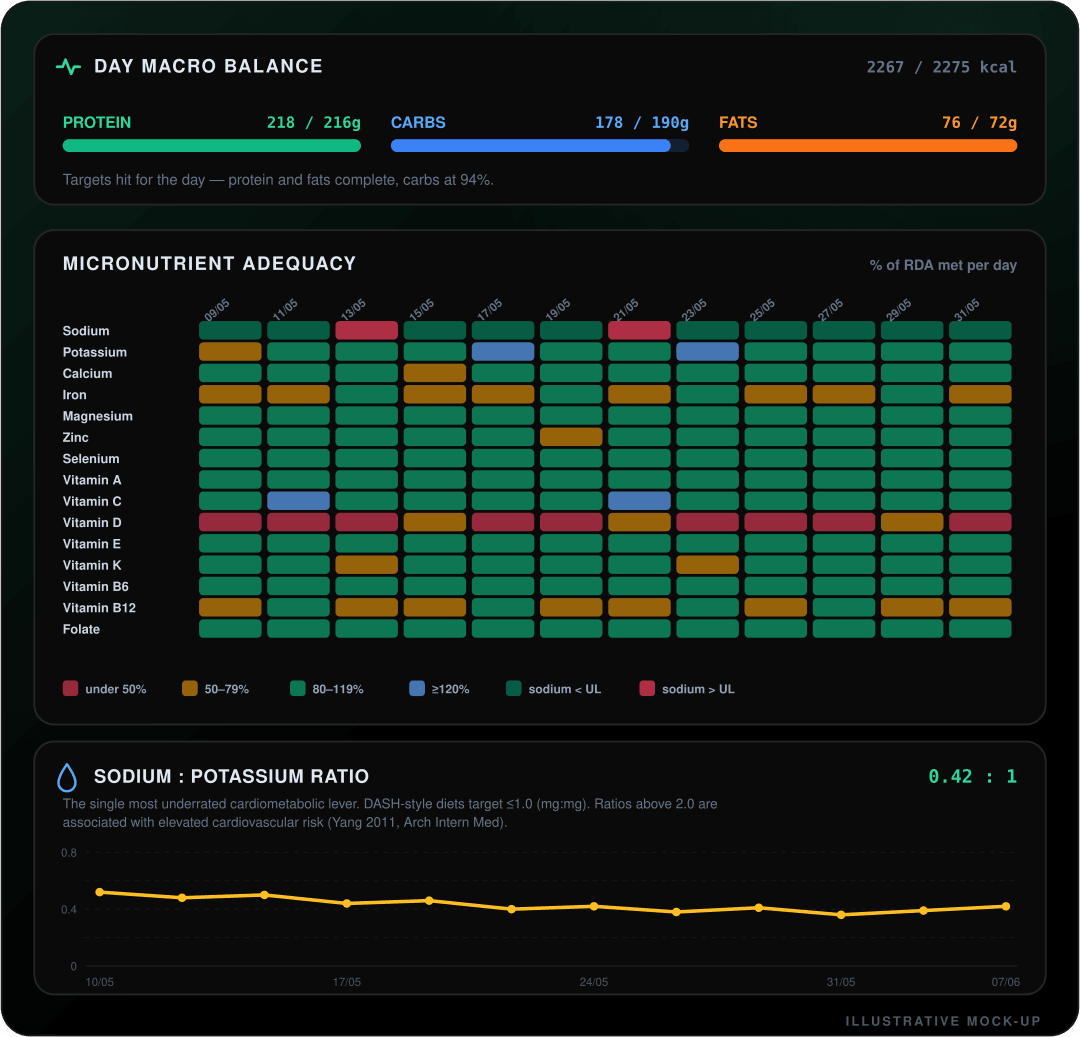
Misi tracks calories, protein, carbohydrate and fat against adaptive targets, plus fibre and protein-per-kilogram of bodyweight — the metrics that actually predict whether you are eating to support training, not just to hit a calorie number.
A full micronutrient panel
Underneath the macros, Misi estimates a panel of micronutrients from your logged foods: sodium, potassium, calcium, iron, magnesium, zinc, selenium, folate and vitamins A, C, D, E, K, B6 and B12 — resolved per ingredient from a detailed nutrition database.
Ratios and adequacy, not just totals
Some of the most useful signals are relationships. Misi surfaces your sodium-to-potassium ratio — a marker tied to blood-pressure health — and maps each micronutrient against adequacy targets in a heatmap, so a recurring shortfall in, say, magnesium or vitamin D is impossible to miss.
Supplements count too
Confirmed supplement intakes layer on top of your food-derived totals, so the adequacy picture reflects what you actually take — not just what is on your plate.
Calories tell you how much you ate. Micronutrients tell you whether you were actually nourished. You want both.
Ready to put this into practice?
Misi BioLabs turns your bloods into a meal plan, training block and AI coaching — in one place.
Start freeFree tools
- PhenoAge Calculator — Biological age from a standard blood panel (Levine 2018).
- VO2max Calculator — Cooper 12-minute test → VO2max + fitness age + mortality hazard.
- TDEE & Macro Calculator — Mifflin-St Jeor maintenance calories + protein/fat targets.