Diet-to-blood-marker bridges: which foods move which numbers
A blood test tells you where you are, not what to change. Misi builds a bridge from each dietary lever to the marker it drives — then tracks whether your numbers are actually moving the right way.
A blood test is a snapshot of where you are. What it does not tell you is what to do about it. Your LDL is 122 — so what should change at dinner tonight? Your triglycerides are creeping up — was it the wine, the white rice, or neither? Most people leave the GP surgery with a number and no lever. The whole point of pairing a food diary with your bloods is to turn that number into an action, and then to check that the action worked.
Food is the lever, blood is the readout
Almost every modifiable blood marker has a dominant dietary input. LDL cholesterol and ApoB respond most to saturated and trans fat; triglycerides and HbA1c track refined carbohydrate, sugar and alcohol; systolic blood pressure follows sodium (and, protectively, potassium); the Omega-3 Index reflects how much oily fish you eat. None of these relationships is a secret — they are some of the best-established findings in nutrition science. The hard part has never been knowing the lever; it has been connecting your lever, in your diet, to your number.
The bridges: which nutrient moves which marker
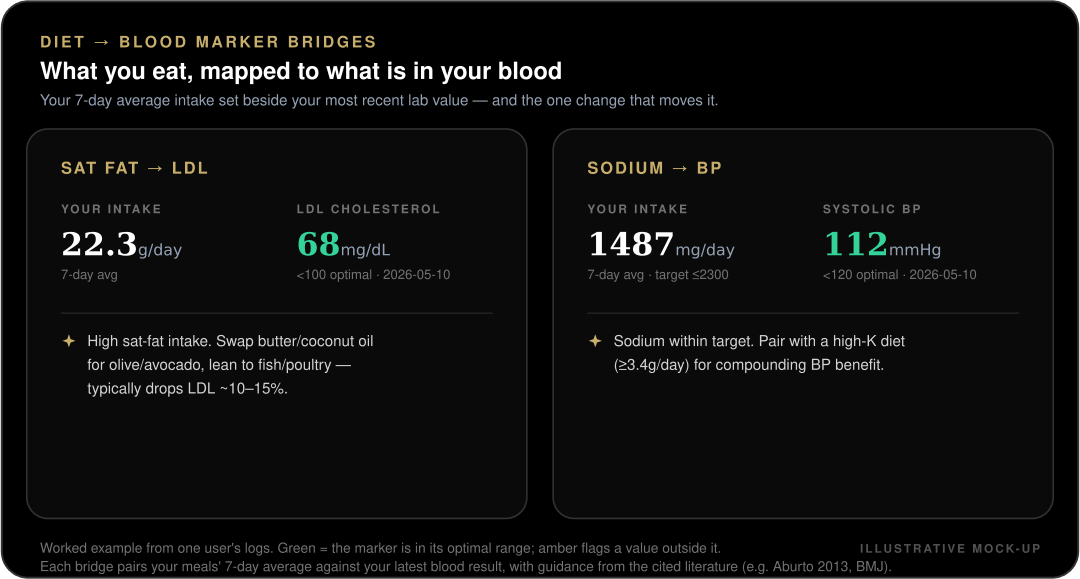
Misi builds a "bridge" for each pairing. On one side sits your 7-day average intake of the driving nutrient, calculated from the meals you logged. On the other sits your most recent lab value for the marker it drives, with the optimal range shown beside it. Underneath, a short, evidence-based recommendation tells you the single most useful change. Sat fat over target while LDL runs high? Swap butter and coconut oil for olive and avocado, lean toward fish and poultry — a shift that typically drops LDL around 10 to 15%. Sodium within target? Keep it there and add potassium for a compounding blood-pressure benefit (Aburto 2013, BMJ).
A single reading is noise — direction of travel is the signal
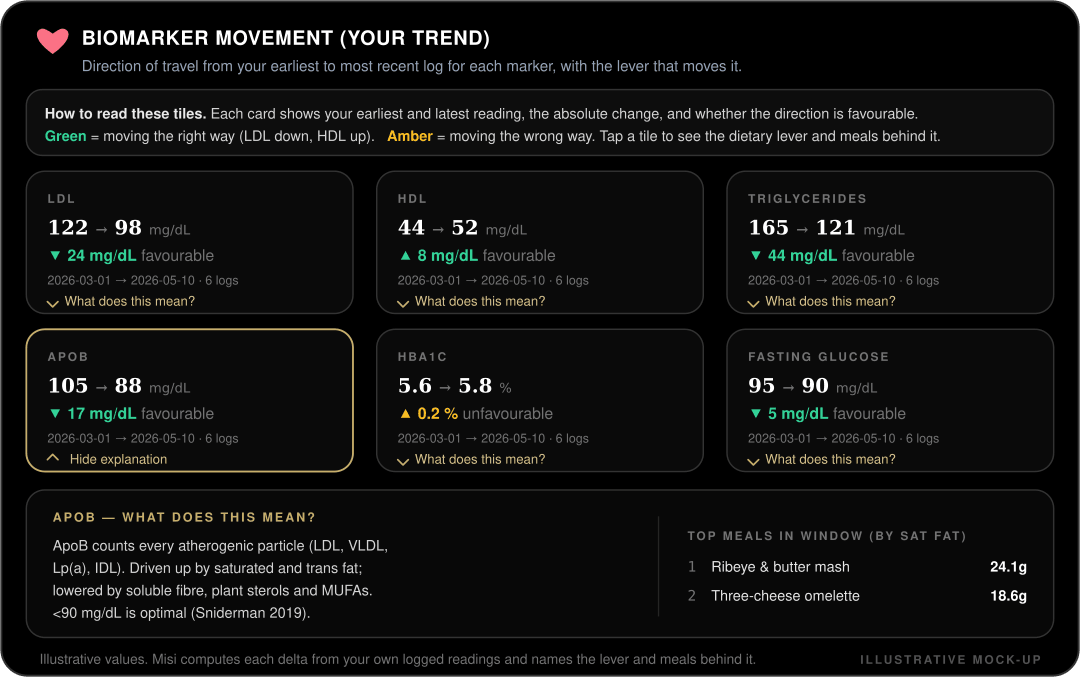
One blood test in isolation can mislead. Markers wobble with hydration, a recent meal, an off night’s sleep or normal lab variation. What actually matters is the direction of travel: is the number moving the right way over weeks and months? That is why Misi keeps every reading you log and shows each marker as an "earliest to latest" movement — the absolute change, and whether that change is favourable for that specific marker.
Green and amber, not good and bad
The colour does not judge the value — it judges the direction. For LDL, triglycerides, ApoB, HbA1c and fasting glucose, down is favourable, so a fall shows green and a rise shows amber. For HDL, vitamin D and the Omega-3 Index it is the reverse: up is the healthy direction. This sounds obvious, but it is exactly the kind of thing that trips people up when they stare at a results sheet — a rising HDL and a rising HbA1c are not the same news, even though both went "up". Misi encodes the direction for you, so green always means "moving the right way for this marker".
The drill-down: which meals actually moved it
A trend is more convincing when you can see what caused it. Tap any marker and Misi expands a short primer — for ApoB: "counts every atherogenic particle (LDL, VLDL, Lp(a), IDL), driven up by saturated and trans fat, lowered by soluble fibre, plant sterols and MUFAs; under 90 mg/dL optimal (Sniderman 2019)" — and then lists the meals from your own diary that contributed most of the driving nutrient in that window. It is one thing to be told saturated fat raises ApoB; it is another to see that your ribeye-and-butter nights were the top two contributors. That is the moment the abstract becomes personal.
How Misi closes the loop
Put the two halves together and you have a feedback loop instead of a filing cabinet. The bridge tells you the lever to pull today; the movement panel tells you, over the following weeks, whether pulling it worked. Log your meals, log each new blood result, and the app keeps score — quietly connecting what is on your plate to what shows up in your veins, and flagging when the two stop agreeing. That is what turns a once-a-year number into something you can actually steer.
A blood marker you cannot act on is just trivia. The value is in the bridge — from the food on your plate, to the number in your blood, to the proof it is moving the right way.
This is general educational information, not medical advice or a diagnostic tool. Optimal ranges are population guides, not personal targets, and the right interpretation of your bloods depends on your full clinical picture. Always discuss your results and any changes to diet or medication with a qualified clinician — particularly if a marker is far outside its reference range.
Ready to put this into practice?
Misi BioLabs turns your bloods into a meal plan, training block and AI coaching — in one place.
Start freeFree tools
- PhenoAge Calculator — Biological age from a standard blood panel (Levine 2018).
- VO2max Calculator — Cooper 12-minute test → VO2max + fitness age + mortality hazard.
- TDEE & Macro Calculator — Mifflin-St Jeor maintenance calories + protein/fat targets.